Nelprof™ helps select a pump for optimum control valve pressure drop
Our guest writer Jon F. Monsen shows how an analysis using our control valve sizing and selection software’s unique ability to graph the installed gain of a control valve can be helpful in selecting the optimum pump for a balance of good controllability and minimum energy use.
The control loop for which installed gain will be analyzed to select a pump that will result in optimum control valve pressure drop.
In a previous posting (Determining the Control Valve Pressure Drop for Control Valve Sizing Purposes) I discussed the correct method for determining the control valve sizing pressure drop when the system already exists or has been designed. The ideal situation is where you have a say in determining what the control valve pressure drop will be, usually by specifying the pump that will be used. Many designers successfully use a rule of thumb that recommends calculating all of the dynamic losses in the system, excluding the control valve, and then adding a pressure drop of one half the other dynamic losses for the control valve and specifying the pump head appropriately. This is equivalent to saying that the control valve pressure drop should be 1/3 of the entire system pressure differential. My preference is, whenever possible, to use an actual analysis instead of rules of thumb.
In this posting, I will show how an analysis using Nelprof™ control valve sizing and selection software’s unique ability to graph the installed gain of a control valve can be helpful in selecting the optimum pump for a balance of good controllability and minimum energy use. Figure 1 shows an example system for which I will use Nelprof™ to help choose the optimum control valve pressure drop. If you are not familiar with the subject of control valve installed gain, you might find this article of interest: http://www.valin.com/resources/whitepapers/installed-gain-control-valve-sizing-criterion
Three possible pumps for the system will be considered and the one that allows satisfactory controllability while minimizing energy consumption will be selected. Curves of P1, the pressure just upstream of the valve, are shown for each of the three pumps along with the power required by each at a normal flow rate of 400 gpm. These curves each slope downward in proportion to flow squared from the 100 gpm pump head (45, 60, and 75 psig respectively for Pumps A, B, and C) to a pressure 10 psi lower due to the combined effect of the 5 psi pressure loss in the upstream piping and the 5 psi decrease in pump head from 100 gpm to 600 gpm stated in the figure. The curve for P2, the pressure at the control valve outlet starts with the 10 psig static head of the tank at very low flows and increases in proportion to flow squared to 30 psig as the downstream piping and heat exchanger pressure losses increase to their 600 gpm values. The control valve pressure drops (the difference between P1 and P2) are indicated in Figure 1 by the arrows at the left side of the figure for 100 gpm and at the right side of the figure for 600 gpm. The analysis will be performed based on using a Neles™ R Series segment ball valve. Figure 2 shows the results of the Nelprof™ installed gain calculation.
Neles’ recommendations for installed gain (and the rules that the Nelprof™ program uses in making control valve recommendations) are:
Within the specified control range:
- Gain ≥ 0.5
- Gain ≤ 3.0
- Gain (max) / Gain (min) ≤ 2.0
- As constant as possible
- As close to 1.0 as possible
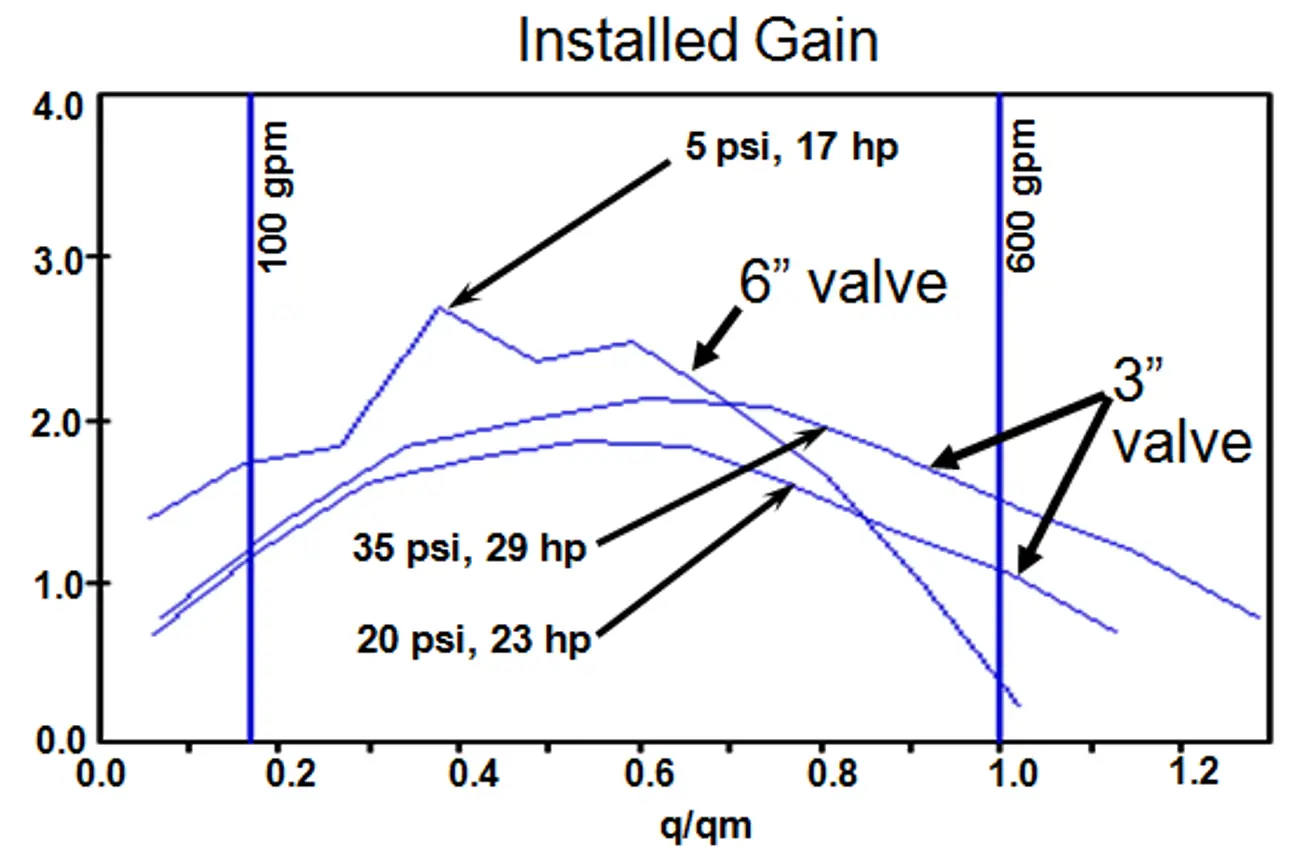
Figure 2. Comparison of installed control valve gain for all three pumps.
With the 17 horsepower pump, besides requiring a more expensive 6 inch valve, the gain graph looks terrible. The installed gain is the highest of the three (meaning a larger flow error for the same valve position error), it drops to 0.4 at the maximum flow and the variation in gain over the flow range is 6.7 to 1, much greater than the recommendation of 2 to 1. This is large enough that it would be very difficult to come up with PID tuning parameters that would give both good and stable control over the entire required flow range. The gain graphs of both the 23 and 29 horsepower pumps fall within the recommended gain criteria, but the 23 horsepower pump is the winner, since its gain is more constant and closer to 1.0, and it is also the more economical of the two to operate.
Note that although Figure 2 shows graphs for more than one valve, this graph was produced by combining three graphs using graphics software. Nelprof™ only shows the graphs for one valve at a time. By clicking on different valves in the project tree at the left of the Nelprof™ screen you can instantly jump from the graph of one valve to another, making it very easy to compare the graphs of several valves.
Text originally published in 2015, and slightly updated in April 2022, due to the company name change to Valmet.

Subscribe to our newsletter
Subscribe now to flow control newsletter and receive the latest insights directly to your email.
SubscribeRead more from Jon F. Monsen

