An introduction to troubleshooting with vibration signatures
Sep 13, 2022
It is universally acknowledged, "Necessity is the Mother of Invention." While everyone was thrilled with the invention of the wheel, it wasn't long before someone addressed the head engineer with, "How long will it run before it #@?@# breaks". Thus Reliability Maintenance was born!
Vibration Analysis is a core component of most Reliability Centered Maintenance programs, and it is here we continue to meet head-on that same age-old question. Indeed, this issue becomes ever more pressing with increased competition requiring the highest effective utilization and efficiency levels of the paper machine.

Success depends on the analyst's proficiency in recognizing how the most common equipment maladies manifest in the FFT and Time domain plots. Following is a brief discussion of a few "vibration signatures" which have been discovered during diagnostic analysis.
Unbalance
There is always some unbalance present in rotating elements. Typically, every mill has a prevailing quality of balance specification to which they adhere in order that resulting vibration be minimized. Types of unbalance are force, couple and dynamic. It usually results in a high radial 1X rotational frequency peak in FFT, see Figure 1. In overhung equipment it can further give rise to a high 1X axial peak. In time domain plots, it is one malady that mimics closely the oft-used training aid - the sine wave.
It must be understood that structural stiffness can differ significantly between the horizontal and vertical planes. In this particular case, the nature of the problem could easily have been overlooked had only the vertical plane been chosen for radial measurement. The horizontal amplitude was 10X higher than vertical. This problem turned out to be a grossly unbalanced driveshaft, and the online system did not pick it up because only the axial plane was measured.
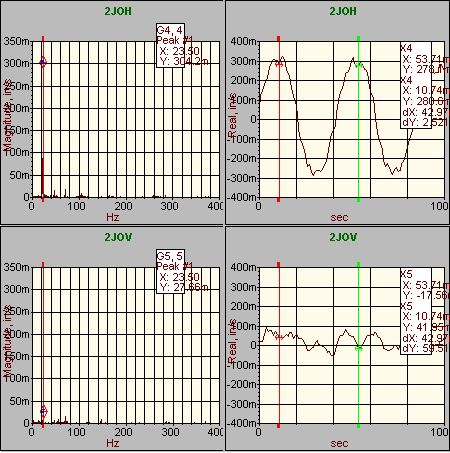
Figure 1 - Unbalanced driveshaft, obvious when both horizontal and vertical planes were measured
Misalignment
Types of misalignment include offset, angular and the combination of the two. More often than not, misalignment is combination. Angular misalignment can create high 1X and 2X peaks in the axial direction and can be 180 degrees out of phase across the coupling. Offset misalignment also creates 1X and 2X peaks, however it usually shows up in the radial direction. The 2X can often exceed the 1X component. The time domain can take on a pronounced W pattern. Figures 2a and 2b are an example of combination misalignment of a press drive train.
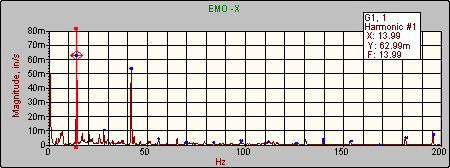
Figure 2a - Combination misalignment of press drive train: Magnitude (in/s) vs. Hertz
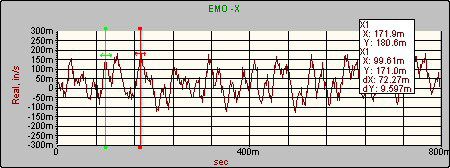
Figure 2b - Combination misalignment of press drive train: Real (in/s) vs. Seconds
Impacting
Impacting can occur with bearing damage or in the presence of structural interference. It can be synchronous or non-synchronous to turning speed. Any significant impacts will always excite surrounding structural resonant frequencies. Therefore, the pattern can usually be readily seen in the time domain. The impact will have an immediate and sharp rise followed by a ringing down; similar to a pattern expected when ringing a bell. Figure 3 shows two examples of captured impacts. The left one is of a suction press roll that had internal interference of the suction box and was impacting 1X/rev. The right plot was measured on a primary screen that was being operated above its hydraulic capacity resulting in intermittent deformation of the basket creating internal interference.
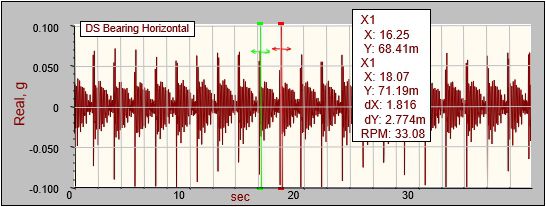
Figure 3a - Suction press roll interference with suction box
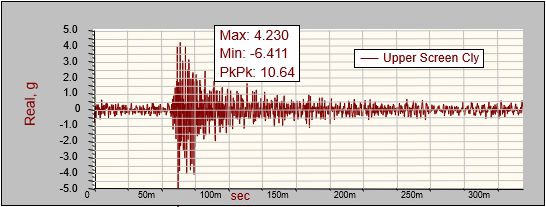
Figure 3b - Primary screen with deformation of basket
Looseness
Looseness can result from wear, cracked welds, loose/broken fasteners, excessive bearing clearance or improper fits. It can often be seen in the FFT wherein exist multiple harmonics of turning speed. There can be as many as 100 harmonics on occasion. Often the amplitudes are fairly low, however, the fact of their existence often portends some underlying problem that will only get worse with time. The higher order harmonics can sometimes become forcing functions that excite otherwise benign resonant frequencies.
Resonance
All structures have multiple resonant frequencies. OEM’s attempt to design machinery in such a manner as to place harmful structural resonant frequencies well away from rotational frequencies. The general trend is to push the paper machine faster and faster to increase production output. At some point this pushes the 1X and 2X rotational frequencies well into areas of potentially harmful resonant frequencies, often with catastrophic affects.
The residual unbalance and misalignment of rolls and drive trains create an excellent in situ shaker if the 1X or 2X rotational becomes near or coincident with a structural resonant frequency. This same shaker effect can be used to our advantage to help find areas of resonance by executing ramp tests prior to any implemented production speed increases. The data is acquired during ramp of contiguous machine sections during controlled acceleration and then deceleration. The speed range should cover the highest anticipated target speeds. Figure 4 is a waterfall FFT of such a test. A waterfall is a succession of FFTs in one multi-axis plot. The axes are X (frequency), Y (amplitude) and Z (time). It can become clear quickly at what speeds might cause problems.
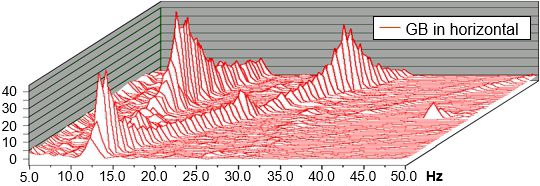
Figure 4 - Ramp test waterfall FFT chart: frequency vs. amplitude vs. time
Summary
This article has not begun to uncover the proverbial "tip of the iceberg" related to Vibration Analysis, yet we hope that it has provided a brief glimpse into the analyst's world. At the very least, we trust you are reassured that there is a certain rationale to the analyst’s rapt glassy-eyed attention to hundreds of Vibration Signatures every day. After all, someone has to answer the question, "how long will it run before it @#??#@ breaks?"
For assistance with vibration assistance and maximizing productive asset lifetimes, contact your Valmet representative.