From ten tennis balls to one – cutting 90% of valve emissions
From ten tennis balls to one – cutting 90% of valve emissions

CHAPTER ONE Strategies needed to reduce the emissions
Many oil & gas companies have already published their strategies to reduce the emissions, and from process industry perspective there are two more drivers in addition to regulations dedicated to lowering fugitive emissions: safety and process efficiency. With low levels of fugitive emissions, plants can more easily ensure healthy and safe working conditions for their employees. Also, in many cases adequate emission performance of the equipment means better process efficiency and improved yield, so it also results in financial benefit. The role of a valve manufacturer in this environment is to support global development by introducing even better technologies and inventions to reduce the fugitive emissions. This is great and rewarding task, but it requires deep expertise from several technical fields, from materials science to practical manufacturing.
CHAPTER TWO Tiny emissions require mighty amounts of knowledge
Let us look at what it takes to develop valve emission capability by one tightness class. The second-best tightness class according to ISO 15848-1 is ‘B’, which is still very much in use, allows a maximum leakage rate of 1,78∙10−6 mbar∙l∙s−1 per mm stem diameter. The equivalent number in the best tightness class ‘A’, is 1,78∙10−7. That is one-tenth of class ‘B’. In other words, to improve the emission class from tightness class B to A, one must reduce 90% of the valve emissions. Reducing such great amounts of already small emissions requires a careful approach and lots of knowledge.
How much do those very tiny emission flows amount to? Let us take an example valve, with a 25mm shaft diameter. According to the ISO 15848-1, tightness class ‘B’ would allow a maximum volume emission flow of 1.4 liters per year. This is roughly the volume of ten tennis balls. The tightest ‘A’ class would allow a maximum emission flow of 0.14 liters per year, resembling roughly the volume of one tennis ball.
Altogether the volume of one tennis ball is not that much, one refinery has thousands of valves installed and if their emission capability is not up to date, the many tiny emission flows contribute to a much bigger total emission flow from the refinery.
To improve the emission class from tightness class B to A,
90%
one must reduce of the valve emissions
CHAPTER THREE How do you reduce 90% of valve emissions?
First, one must know all the essential parameters in valve packing design contributing to valve emissions. When considering a valve packing, parameters include the effect of packing ring’s compression force and the effect of packing bore and shaft surface roughness. After finding the parameters, one should also find the optimal values or optimal range for the values. Finding the optimal values requires lots of careful testing. The use of modern simulation tools can speed up this work considerably. Furthermore, quality techniques, such as Six Sigma will shed light on the complex network of dependent variables behind valve emission capability.
The design alone does not automatically yield valves with excellent emission capabilities. In addition to design, there needs to be a very tight and seamless collaboration between manufacturers making valve components and skillful workers assembling them right. Building a valve with optimal emission performance begins with components carefully manufactured according to specifications. Any flaws in the components may reflect in emission performance. In addition to the component manufacturing, the assembly process of a valve must be done with utmost accuracy and care, down to the smallest details.

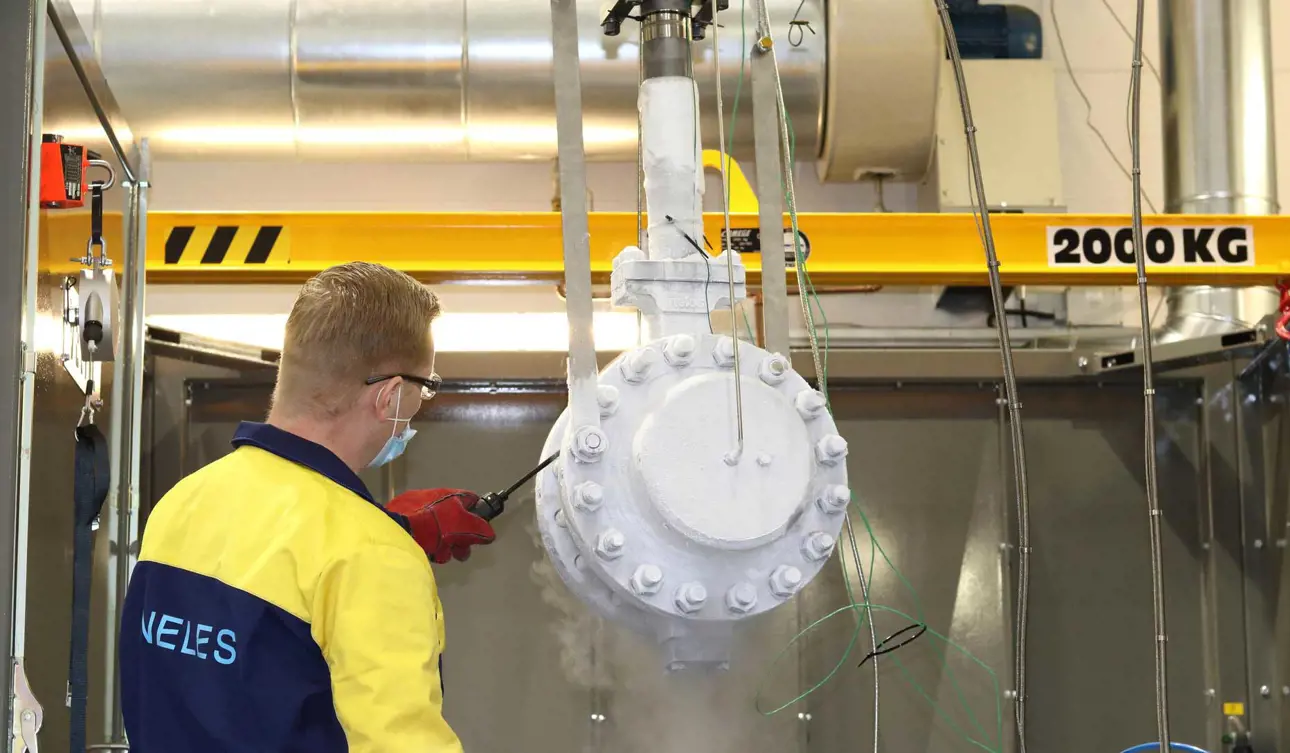
The third link in the chain is the testing laboratory. Simulation tools can help, but good emission capability requires a vast amount of testing. This starts at the material and component level, all the way up to valve assemblies of a valve and actuator. Emission performance is often tested with helium as a test media where the possible helium flows are detected using a helium sniffer. The process of finding the right values for emission parameters includes a fair amount of trial and error. When everything is done right, the final validation and proof of great design and manufacturing effort can realize the excellent emission capability of a valve.
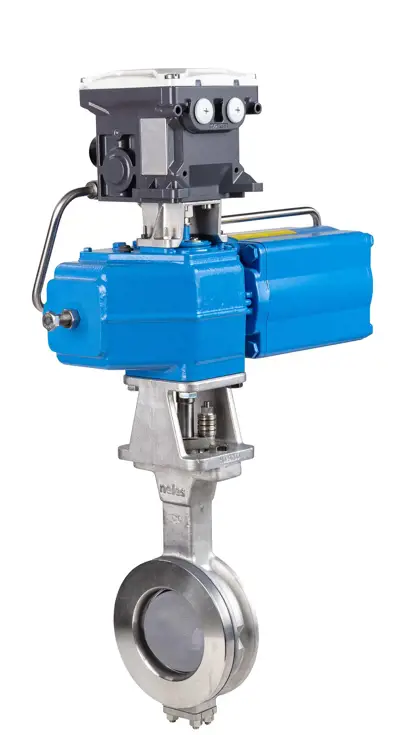
It is a good achievement to meet the tightest ‘A’ emission class in an on-off valve where the valve will not operate that many cycles during its life cycle. It is a great achievement is to achieve – and remain – in the best possible tightness class for a control valve operating a huge number of open-close cycles in its lifetime.
CHAPTER FOUR The very fine balance between tightness and long-lasting tightness
There are two categories of tightness certificates for valves. In the on-off category, the challenge is to achieve the stringent ‘A’ tightness class. In the control valve category, the first challenge is the same, meeting the ‘A’ tightness class, but the second can be even more challenging: maintain the ‘A’ class emission capability over 100,000 operation cycles, in the most demanding test.
In principle, one can design a very tight valve packing by simply adding a huge compression force over the valve packing rings – the tightness is guaranteed. However, when one starts to operate the valve by rotating the valve shaft, the packing rings start to lose their tightness very rapidly due to wear in the rings. Thus, one needs to find the very fine balance by adding enough compression force to achieve the needed tightness class, but no more to have the packing ring wear under control during the 100,000 cycles.
Vast changes in flow media temperatures cause challenges for valve design and manufacturing. Neles can deliver valves to very low temperatures, the new liquid hydrogen applications go down to -253°C – which is only 20 degrees above the absolute zero point (-273,15°C). In hotter applications, the temperature can be almost 800°C above the liquid hydrogen temperatures. The vast spread in process temperatures set different kinds of requirements for valve material selection and design, as well as testing at various temperatures.
CHAPTER FIVE Closing the loop with life cycle care
To demonstrate this challenge and its impact on a global scale, let us use a practical example. Cutting 90% of valve’s fugitive emissions can roughly be translated into reducing the leakage from a size of ten tennis balls to a size of one tennis ball only. As discussed above, such an improvement requires careful attention during the entire design and manufacturing phase of the valve, but when this is ramped up to the global scale, the environmental impact is huge. There are millions of valves operating in plants around the world that have been specified tens of years ago that do not anymore meet today’s more stringent requirements. Therefore, upgrading their fugitive emission capabilities can turn into a significant act from environmental perspective.
However, even the best construction does not last forever, as all materials tend to wear when exposed to load and friction. Therefore, easy serviceability and professional maintenance personnel play a crucial role in the low emission performance during the valve life cycle. As we have learned, the surface roughness of the packing bore, for example, has a significant effect in cutting the emissions, so even one minor error in service can destroy the tightness of the valve packing. Neles recommends always using qualified service personnel to hold the responsibility of the entire overhaul, starting from planning which part of the equipment should be serviced and which are critical parts that should be changed. This will ensure that a safe working environment, reliable functionality and environmental goals are considered – and brings us all one small step closer to a carbon-neutral society.
Text: Jukka Borgman and Taija Hämäläinen. For additional information, please contact sari.saxholm@valmet.com and tommi.bergstrom@valmet.com
This article has been originally published in Fugitive Emissions Journal, June 2021 issue. Link to the original article
Subscribe to our newsletter
Subscribe now to flow control newsletter and receive the latest insights directly to your email.
SubscribeRead more about fugitive emissions and valve testing


