To the finest fiber detail
Dec 5, 2019
Better knowledge of raw material fiber properties with the Valmet Fiber Furnish Analyzer has helped the BillerudKorsnäs board mill to improve their stock preparation. Additional expert support is provided remotely from the Valmet Performance Center.
With a total of over 150 production grades, extensive knowledge of raw material fiber properties is essential to help meet the high quality that customers have come to expect and rely on for subsequent converting operations. To this end, the mill decided in 2018 to purchase the soon to be introduced Valmet Fiber Furnish Analyzer (Valmet MAP Q). “Our device was one of the first installations with an ultra high definition camera for online fiber analysis,” says Matti Myllylä, Production Superintendent in Pietarsaari. “It was the start of a very good cooperation project that continues today almost one year since the analyzer start up. The support from Valmet, both on-site and using the remote connection capability of the analyzer, has been really good to make it a relatively smooth experience.”
Valmet MAP Q - Improved stock preparation

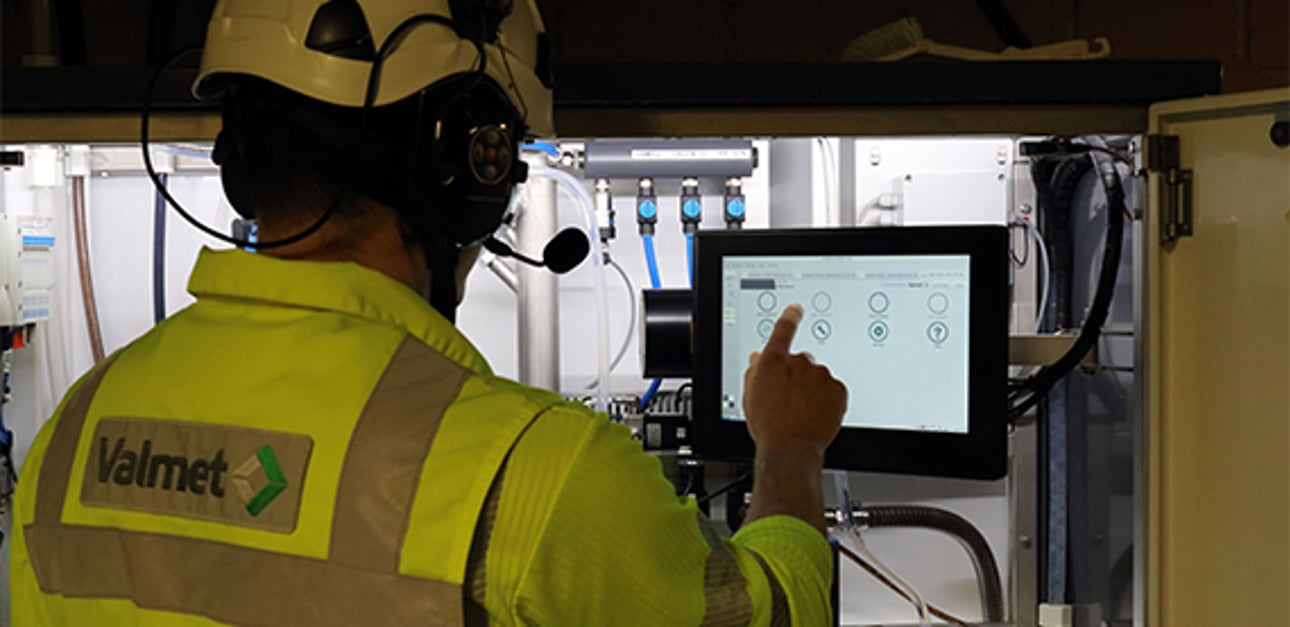
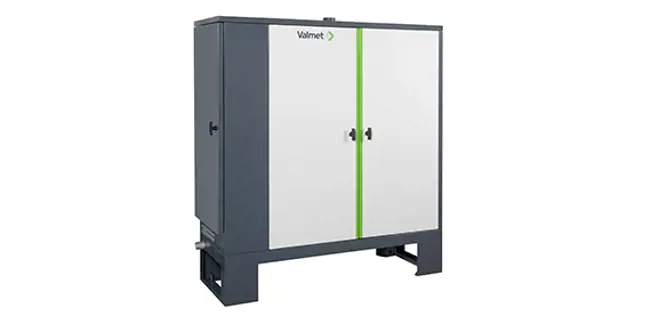
The Valmet MAP Q installation in Pietarsaari
The new MAP Q analyzer incorporates new fiber imaging technology which provides micro-scale details from fiber dimensional properties to shives and their size categories. Monitoring incoming pulp quality and subsequent fiber development provides the opportunity for better control of stock preparation. Further improvement can be achieved with a built in modeling tool that can continuously predict pulp properties from a combination of the analyzer’s measurements. As well as measuring wide range of fiber and shive properties, the device also characterizes irregular particles including vessel segments, flocs and other particles. An additional measuring module for standardized freeness (Canadian Standard Freeness and Shopper-Riegler) plus a chemistry module to monitor pH, conductivity and consistency completed the delivery to the Pietarsaari paper mill.
Essential information

One of the eight samplers
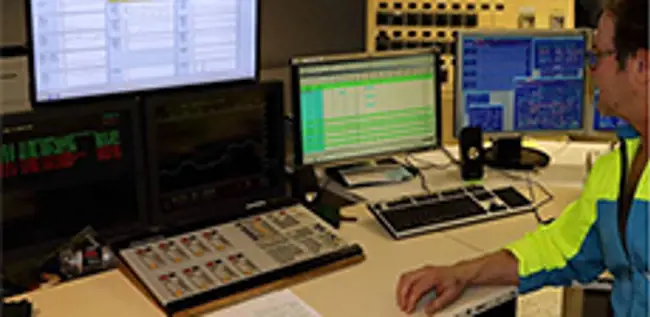
Eight sampling points had been decided on, firstly to monitor incoming bleached and unbleached pulp and then to follow fiber development after the HC and LC refining stages. Final pulp quality is monitored with a sampler after the machine chest and another in the headbox recirculation. The eight sampling points are automatically measured in sequence with each measurement taking approximately five minutes. “The Valmet MAP Q includes a really good software client and user interface which provides me with essential information at my desk, especially valuable when running trials or troubleshooting. We can see immediately the effect of process changes on the fiber without waiting for laboratory tests or samples from the reel,” says Myllylä.
We can immediately see the effect of process changes on the fiber, without waiting for laboratory tests or samples from the reel.

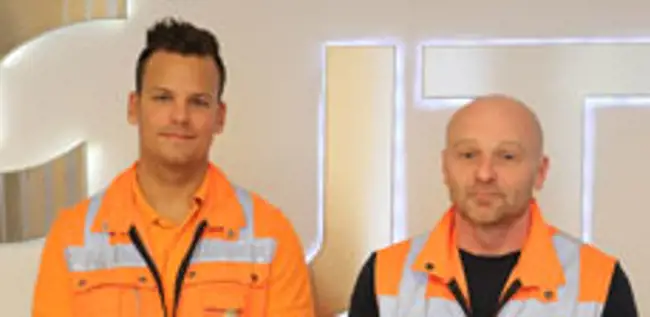
Jyrki Härkönen and Matti Myllylä take a closer look at trends from the MAP Q measurements
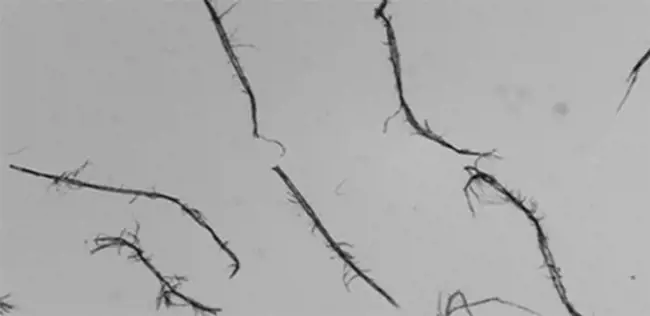
Early evidence of fiber spins
“For certain grades, fiber spins (where fibers mechanically entangle themselves very tightly) can be a particular problem as they project from the surface of the paper and cause holes in a later applied barrier coating or lamination. MAP Q has shown that some of the fiber spins are present in the incoming pulp and some are created in our stock preparation. With 50 minutes from pulp coming into the mill to the reel, MAP Q provides much earlier evidence of fiber spins and we can adjust process conditions to minimize them,” explains Jyrki Härkönen, Production Development Engineer. “The analyzer has shown us the effect of refining conditions and issues like plate wear on fiber spins and other pulp properties to enable future follow-up for further improvement.”

Trends as well as high definition fiber images, shown here at the analyzer, are available on the mill network for further analysis.
Remote support from the Valmet Performance Center
Following installation, the first calibrations were made during start-up at the end of November 2018. After a second onsite visit by Valmet for the SR freeness calibration and introduction of the chemistry module, the remote connection capability then came into use, “Our laboratory technician took samples from the analyzer and the Valmet engineer was able to remotely make the necessary calibration adjustments. With the remote connection, Valmet assistance is always close by for help with process troubleshooting and equipment support,” says Härkönen, “Additional SR freeness calibration has been done remotely to further increase accuracy and today we are closely following the SR values, fiber length and fibrillation degree, which will enable us to develop control models to optimize refining and save energy. We are still in the learning phase but a thesis project starting in 2020 will take us much further,” adds Myllylä.
Process engineer’s tool
“Today we operate the analyzer as a process engineer’s tool, but ongoing work to integrate the measurements in the process control system will see us take the next step to automatic control of refining,” says Myllylä. “We can have up to 15 grade changes per day and presently adjust conditions according to grade specifications. Now with the analyzer we have the capability to enhance control according to incoming pulp properties as well as matching grade specifications to the incoming pulp. We can now produce certain grades according to incoming pulp properties and optimize refining, which translates to energy savings and reduced broke while producing the same high quality,” declares Myllylä.
Text and photos Nigel Farrand
Related articles