Investments
EUR million
|
2023 |
2022 |
2021 |
2020 |
2019 |
2018 |
2017 |
2016 |
2015 |
2014 |
2013 (carve-out) |
|
|
Cash flow provided by operating activities |
352 | 36 | 482 | 532 | 295 | 284 | 291 | 246 | 78 | 236 | -43 |
|
Gross capital expenditure (excluding business combinations and right-of-use assets) |
125 | 112 | 97 | 89 | 79 | 79 | 66 | 60 | 44 | 46 | 54 |
|
of which share of maintenance investments, % |
46 % | 33% | 40% | 40% | 77% | 47% | 56% | 67% | 82% | 80% | 76% |
|
Proceeds from sale of fixed assets |
6 | 2 | 2 | 1 | 6 | 6 | 2 | 2 | 3 | 4 | 4 |
|
Business combinations, net of cash acquired and loans repaid |
-415 | 117 | -15 | -48 | -163 | -2 | - | - | -323 | - | -3 |
|
Cash flow after investing activities |
-181 | 56 | 382 | -60 | 58 | 208 | 227 | 188 | -287 | -194 | -97 |
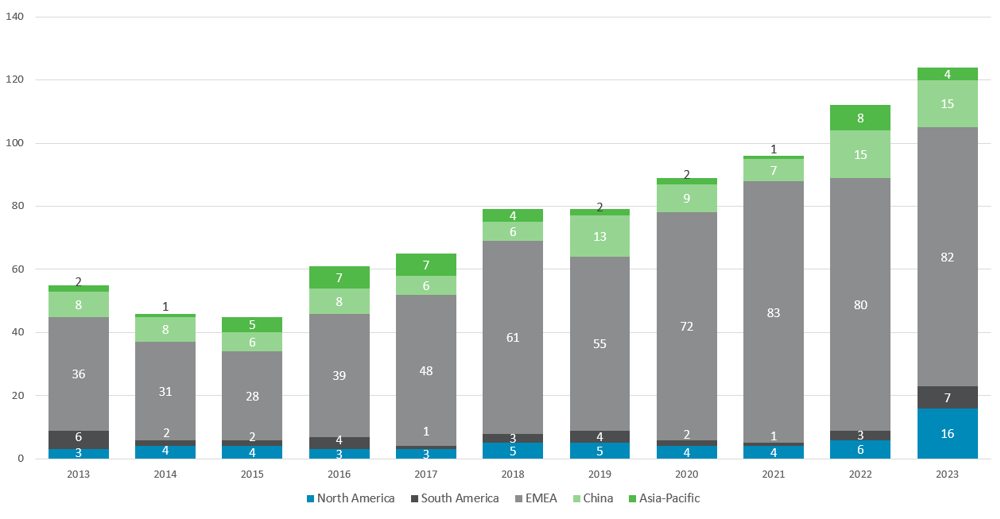
Gross capital expenditure (excluding business combinations and right-of-use-assets) by location, EUR million