Vibration analysis - introduction to techniques and equipment
May 18, 2021
This article is intended to provide the reader with a clear, effective and illustrated introduction to vibration analysis techniques. The objectives are:
- Identify fundamental principles and definitions associated with vibration analysis.
- Describe the basic equipment and instrumentation used when applying vibration analysis techniques.
- Discuss the methods used to identify specific component problems through spectral analysis.
Introduction to vibration analysis
Any person that has worked around machinery has an idea of what vibration is.
With certainty it can be said that a paper machine has never been, and never will be built that does not vibrate to some extent. As machinery builders and maintenance personnel, it is our responsibility to limit the amount of vibration so that product quality and machine life is not adversely affected by it. With machine speeds and widths ever increasing, this job becomes more important and at the same time more difficult.
When a paper machine is vibrating, it is talking to us. Just as a doctor listens to and understands the strange noises coming out of our chest, we can diagnose the health of our machines by “listening to” the vibrations that they generate.
With modern electronic instrumentation we can determine the source of the vibration and the severity of the problem that is causing it. Once the problem is identified, maintenance work can address the most critical problems first. This concept is the basis for Predictive Maintenance (PDM). An effective PDM program, along with a good Preventive Maintenance (PM) program, can maximize machine component life, reduce downtime, improve product quality, and minimize the likelihood of a catastrophic failure.
Vibration definitions and principles
We will consider a simple case of a vibrating system in order to define some terminology which is used in describing vibratory motion.
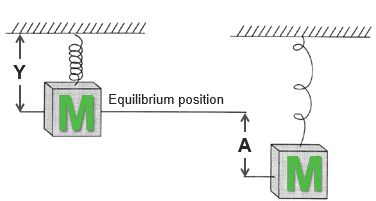
Basic vibrating system
This vibrating system shows a solid mass (M) that is suspended from a rigid support by a spring. If we deflect this mass at distance "A" beyond its equilibrium position and then let it go, it will oscillate in an up and down motion. If there were no damping (resistance to the motion, e.g. wind resistance) in this system, the mass would continue to oscillate at an amplitude equal to two times "A" indefinitely.
Free and forced vibration
The mass and spring system is in a condition of free vibration when displaced from its equilibrium position and allowed to oscillate. If, on the other hand, a force is acting on the structure that is causing it to vibrate, then it is forced vibration.
Natural frequency and resonance
The frequencies at which free vibration occur are called natural frequencies. This has one natural frequency, whereas a complex structure such as a paper machine will have many natural frequencies. The motion that a structure undergoes will be different for each natural frequency; the higher the natural frequency, the more complex the motion.
When a system is under forced vibration, it is being excited. If a system is excited by a force which is oscillating at a frequency equal to one of its natural frequencies, then it is in a state of resonance. This should be avoided, as high vibration amplitude can occur. In the case of a paper machine, high vibration amplitude results in large oscillatory stresses on the components of the machine, which can lead to rapid fatigue failure. As machine designers, we design the structure so that the natural frequencies will not be excited by forces such as those caused by roll imbalance, when the machine is operating at or near design speed.
Vibratory motion
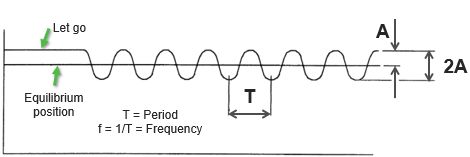
Vibratory motion
Here the period (amount of time for one complete cycle) is T and the frequency is equal to 1/T. The units of time used in machinery vibration analysis are seconds or minutes. Frequency units are therefore cycles/second or cycles/minute (CPM). The frequency unit cycles/second is given the special name Hertz, abbreviated Hz. Thus, two cycles per second is usually described as 2 Hz.
Mass and stiffness
The frequency at which this system will freely vibrate is determined by the stiffness of the spring and by the mass (or weight) of the solid object. Increasing the stiffness of the spring will increase the natural frequency, i.e. it will vibrate faster. Increasing the mass of the solid object will, on the other hand, lower the natural frequency. It is the mass and stiffness of paper machine components that the equipment designers can specify such that resonance will not occur at or near design speed. However, when machine speed is increased beyond design, or structural modifications are made, then it might also be necessary to change the system mass and/or stiffness to avoid a resonance problem.
Excitation forces
Unbalance force
There are many sources of excitation force that can cause a paper machine to vibrate.
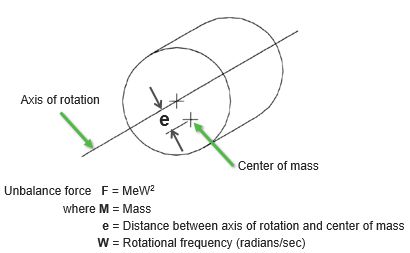
Unbalance force
Most obvious is roll unbalance. Unbalance occurs when the center of mass (or gravity - c.g.) for a rotating body does not coincide with the axis of rotation. The amount of force that the rotating body will exert on the structure supporting it depends on the amount of unbalance (m*e) and the rotation speed. All rotating bodies will have some amount of residual unbalance. The allowable amount of unbalance depends on speed of the machine. (The higher the machine speed, the lower the amount of allowable unbalance).
It is extremely important that the amount of allowable unbalance, as well as the balancing speed, be specified when paper machine rolls are sent to be balanced. (Example: Balance to 4000 (FPM) is a meaningless statement.)
Coupling misalignment
Another major source of excitation force in paper machinery is misalignment. Rolls in nip that are not aligned properly will try to drive each other out of the machine, resulting in a cross machine direction (CMD or axial) force on the structure, which often oscillates at 1/rev or 2/rev of one of the rolls.
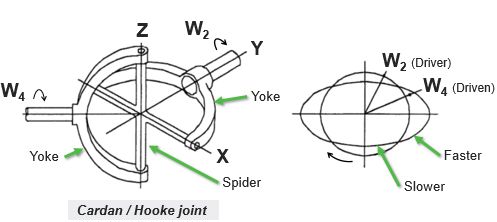
Coupling misalignment
Likewise, in-shaft misalignment can cause a 2/rev speed variation in the driven component. The 2/rev speed variation normally results in vibration at a frequency corresponding to 2x roll speed.
Roll eccentricity or corrugation, as well as felt/caliper stiffness variations are another major source of excitation force in paper making equipment. When rolls are not round, or felt thickness varies, the rolls are forced to move relative to each other in an oscillating manner. The machine feels a force exerted by the rolls as it tries to restrain them.
Bearing defects
Bearing defects can also generate an oscillatory force.
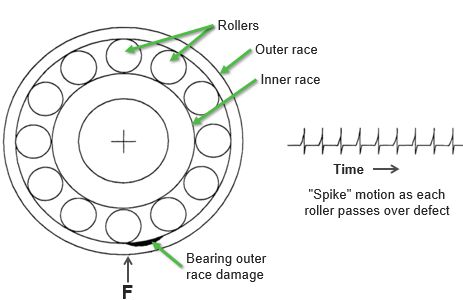
Bearing defects
If the defect is on a race, a pulse of energy is emitted each time a roller passes over the defect. This vibration can be sensed on the bearing housing and used to identify defects in their early stages. Plans can then be made to replace these bearings during normal machine outages. Useful bearing failure terms are:
- Ball pass frequency outer (BPFO): The number of balls/rollers passing through a given point of the outer race each time the shaft turns.
- Ball pass frequency inner (BPFI): Similar to BPFO but for the inner race.
- Ball spin frequency (BSF): The number of times an individual ball/roller will turn each time the shaft makes a complete turn.
- Fundamental train frequency (FTF): The number of turns a bearing cage makes each time the shaft turns.
Other excitation sources
Other excitation forces that cause paper machine vibration are: dryer condensation, unstable drives and machinery across the aisle, but these are but a few of the many possible examples.
Principle of superposition
Paper machine vibrations are normally very complex. The reason for this complexity is that the vibratory motion at one point of a machine is the sum of all forces acting on that particular point. A variety of forces may affect the vibration readings at a given point.
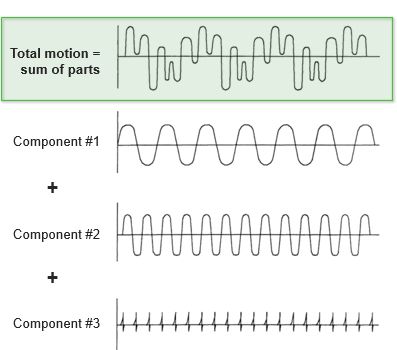
Principle of superposition
The individual forces are very periodic or regular (constant frequency), but the total motion response appears random, or irregular. Fortunately, electronic instruments can break down the complex motions into its constituent parts, so that the source for each can be identified.
Vibration instrumentation
Transducers
Vibration measurement instrumentation is wide ranging and complex. This section will provide a brief description of some instruments and certain considerations in their selection and use.
The most fundamental part of a measurement system is the transducer. It provides an electrical signal that varies in proportion to the physical quantity that is measured. Displacement, velocity, and acceleration are units of vibratory motion that are measure with transducers. There are transducers that provide electrical signals based on each of these principle quantities.
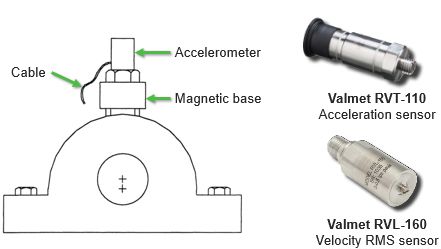
Accelerometer mounting and sensors
Accelerometers provide a signal proportional to the acceleration under which it is subjected. When it is mounted on a machine, it measures the acceleration of the structure at that point. Accelerometers are usually small, and therefore easily attach to the machine with a magnet. There are accelerometers available which can measure very low frequencies (tenths of a Hertz) to very high frequencies (many thousand Hertz). However, they are most suitable for measuring higher frequency vibrations, such as those generated by bearings and gears. The accelerometer requires an external power source.
The output of a velocity transducer varies with the velocity of the structure to which it is attached. While the physical quantity of velocity is most desirable to measure (by convention), most velocity transducers have a drawback which make them unsuitable for certain measurements on the paper machine. The shortfall of this sensor is in frequency response.
The typical velocity transducer does not respond to motions at frequencies less than 10 Hz (cycles/set). The rotating frequency of many paper machine rolls is less than 10 Hz. Higher frequencies, such as bearing and gear frequencies can be readily measured, however. The velocity transducer is mounted to the machine in the same manner as the accelerometer but can be sensitive to its orientation with respect to gravity. Its size is generally larger than an accelerometer, which can cause mounting difficulties. The velocity transducer is less rugged than the accelerometer. The velocity transducer does not require a power source, which is considered an advantage over other transducer types.
Another transducer is the velometer, or internally integrated accelerometer. This sensor works on the same measurement principle as the accelerometer, but internal circuitry provides an output proportional to the velocity of the structure that it is mounted to, This technique provides the advantages of velocity output, with the small size, ruggedness, and frequency response of the accelerometer.
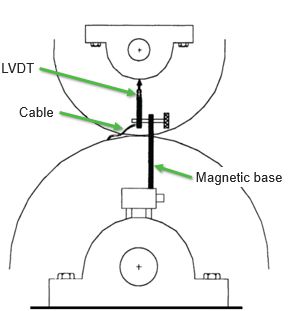
Typical LVDT application
Several types of displacement transducers are available: most commonly, the eddy probe and the LVDT. These sensors provide electrical signals proportional to the displacement of an object relative to some other object. They must be attached to one object to measure the motion of another.
It is often desirable to measure displacement, the mounting considerations often make them difficult to use. These types of transducers are most suitable for low frequency measurements, such as those generated by paper machine rolls. An external power source is required for all types of displacement transducers.
Signal analyzers
Once a transducer is affixed to a point on a paper machine where motion measurements will be taken, the problem of interpreting the complex electrical signals. arises. Instruments that have been developed for this purpose are called signal analyzers. These analyzers interpret complex electronic signals and breaks them down into their component parts. In order to show the various components of the signal separately, the signal analyzer displays the spectrum domain and is then called a spectrum analyzer.
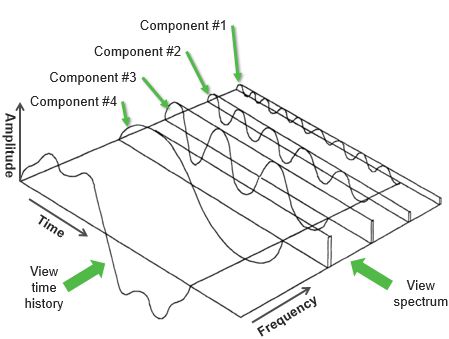
Spectrum analysis - the spectrum view
In the spectrum view, each component of the signal is represented by a single vertical line, with its amplitude shown by the height of the line, and its frequency shown by its distance down the "x" axis in the display.
Fast Fourier Transform (FFT) analyzer
Spectrum analyzers have been in use for many years. The earliest type worked on the same principle as the tuner in your radio or television. This type of analyzer was "tuned" to a signal of a particular frequency by turning a dial and watching the deflection of a meter. A later development was the addition of "automatic tuning", i.e. the tuner swept through the frequency range of interest automatically and displayed the frequency domain on a scope and/ or x-y plotter. This type of monitor was appropriately named swept filter spectrum analyzer.
Mathematical techniques have been available to manipulate data from a time series representation to the frequency domain since the French physicist and mathematician J. P. Joseph Fourier first developed the methodology in 1811. These techniques were cumbersome and time-consuming to utilize however, until the advent of the personal computer.
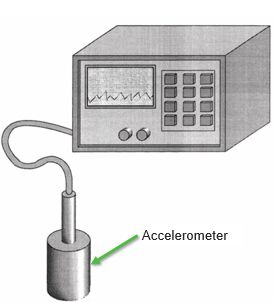
FFT analyzer
Shortly after the development of the microprocessor, the mathematical algorithm was incorporated into small, dedicated computers for signal analysis, called FFT (Fast Fourier Transform) analyzers.
Signal analyzers have progressed steadily in complexity and processing speed, as have all computing devices. At the same time, the size of the instruments has been reduced. Today, much more analysis power is packaged in a box the size of one of the original single channel instruments of yesteryear.
The signal analyzer that was Valmet's workhorse beginning in the 1980s could simultaneously display four channels of real time spectra, store waterfall displays (sequentially cascaded spectra presenting a three dimensional view of amplitude vs frequency vs time) of up to 200 lines and perform a myriad of other mathematical functions on incoming signals.
Portable data collector
Of increasing popularity in mill maintenance departments is the very lightweight and portable data collector. A typical system consists of a collector box and probe, a personal computer and printer, and the specialized software. The software handles the communication between the PC and the data collector and manages the data base.
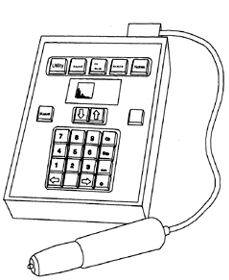
Portable data collector
In this type of system, a route through the mill is entered into the software that is then downloaded into the data collector. The vibration analyst then walks through the plant, prompted by, the data collector to, take measurements at each preprogrammed point. Upon completion of the route, the collected data is uploaded into the PC for printout and storage. These systems are very efficient at recording measurements at given locations on a regular, repetitive basis.
A complete portable instrumentation system for vibration analysis will include a variety of transducers, at least one signal analyzers, and a great deal of support equipment. Discussion of support equipment, such as amplifiers, power supplies, cabling, analog (tape) recorders, filters, connectors, etc., is beyond the scope of this article. It must be emphasized, however, that the system will only be as good as the weakest component part, so a good deal of attention must be paid to some of these seemingly insignificant pieces.
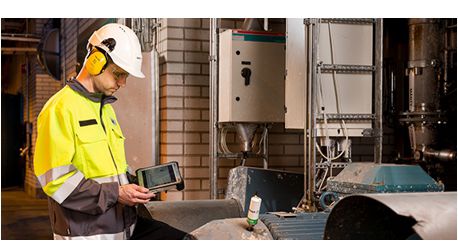
Route-based condition monitoring with Valmet Maintenance Pad
Nowadays, Valmet can accomplish route-based conditioning monitoring using a tablet computer called the Valmet Maintenance Pad. This rugged data logger and analyzer for route-based condition monitoring is IP65 and MIL-STD-810G certified to let you work virtually anywhere.
Maintenance Pad is a fully functional industrial tablet computer with Valmet Machine Analyzer software that includes route planning, route and off-route measurements as well as efficient tools for vibration analysis.
Continuous monitoring system
The high costs of machine downtime and the ever increasing demands for high product quality have given rise to the use of continuous monitoring systems on paper machinery.
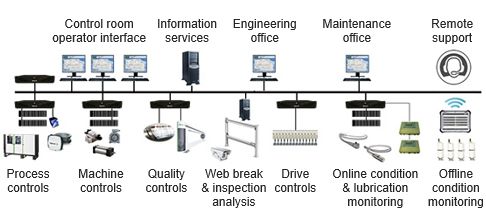
Continuous monitoring system, e.g. Valmet DNA Machine Monitoring
The installation will continuously measure short term product quality variations and process disturbances and vibrations. The vibration transducers are permanently mounted on critical rolls and their signals are carried into a central computer for processing. Current vibration data is readily available to the machine operator or the maintenance vibration analyst. The data can be viewed at operator consoles typically located in the control room, or remotely by modem and personal computer.
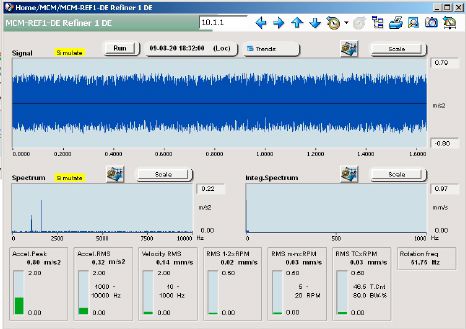
Valmet DNA vibration analysis user interface
The remote access feature of continuous monitoring systems is particularly useful when mill personnel are looking for outside assistance in troubleshooting certain problems. The system can be accessed remotely by the machinery supplier, or other consultants. This can significantly increase the speed at which outside consultants can respond to a request for help.
Valmet's Performance Centers are an integrated, structured way to operate with Valmet’s global organisation for automation, process or equipment improvements. They provide the fastest route to case resolution through remote expert support with a high standard for customer experience. Through continuous collaboration we can improve quality, cost efficiency and productivity. Better equipment reliability can be achieved by automated monitoring and predictive alerts. This also offers knowledge transfer to mill teams through collaboration.
Case study : suction press roll front bearing
Problem area
Spectral analysis identified high outer-race frequencies on the suction press roll front-bearing.
Identification
Spectrums identified outer-race frequencies (BPFO) of 4656, 9317, and 13,987 CPM with an overall amplitude of .313 in/sec. Because of the high vibration amplitude and the felt-life reaching 40 days, the machine was taken off-line to replace the suction press and top press rolls, as well as both top and bottom felts. Further inspection of the tending-side bearing revealed the outer-race cracked in half, rollers were chipped, and the inner-race was completely spalled. Before and after spectral comparisons verified the diagnosis.
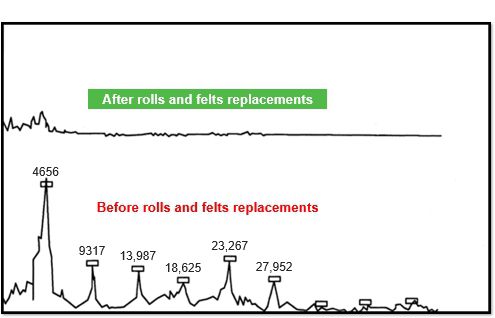
Case study - Before and after spectral comparisons
Conclusion
If high vibration amplitudes remain constant in a specific area or component of a machine, immediate inspection should follow.
Summary of vibration analysis
Vibration analysis techniques, when properly applied, have proven to be a very cost-effective method of a Predictive Maintenance program.
With modern instrumentation, imminent component failure can be detected prior to machine shutdown. A small investment in modern vibration analysis equipment can save time and money later. These diagnostic methods reduce downtime, minimize the possibility of catastrophic failure, and ultimately improve paper quality.
For assistance with vibration analysis and condition monitoring, contact your Valmet representative.